At Mosaic Diagnostics, our goal has always been to make complex biochemistry clinically actionable. The Organic Acids Test (OAT) has long been one of our most powerful tools for connecting metabolic imbalances to individualized care.
Now, with our newly revised OAT report, we’ve taken that mission even further, enhancing clarity, streamlining interpretation, and introducing new visual and educational features to support practitioners in translating results into informed care decisions.
This update builds on decades of biochemical research and practitioner feedback, bringing forward a more intuitive and clinically robust report that better connects metabolic imbalances to practical therapeutic support.
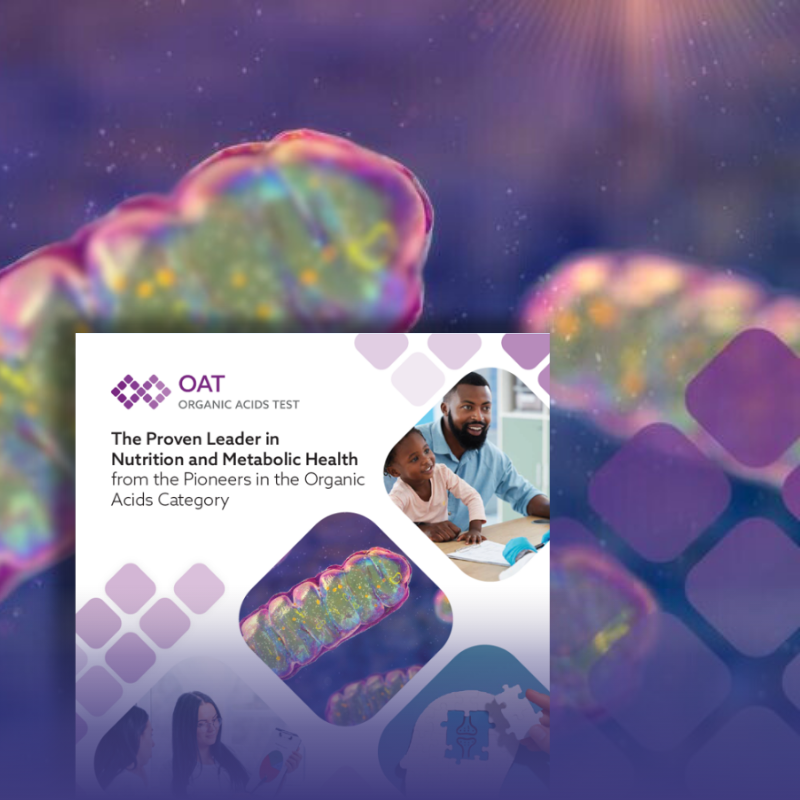
What is the Organic Acids Test and Why It Matters
The Organic Acids Test analyzes 76 compounds found in a single first-morning urine sample, reflecting activity across multiple biochemical systems to assess metabolic health. These metabolites are byproducts of essential processes—energy production, nutrient metabolism, detoxification, neurotransmitter synthesis, and microbial balance. Abnormal levels can indicate issues like enzyme dysfunction or nutrient deficiencies.
Results help guide personalized interventions such as nutrient support, microbiome balancing, and detoxification support.
It’s important to note that although the profile has been updated, the reference ranges, testing methodology, metabolites analyzed, and the overall structure of results remain unchanged.
Discover the latest enhancements to our OAT report in this blog, and check out our video walkthrough here OAT Report Review Video.
What’s New in the MosaicDX OAT Report?
Explore the sections below to review each topic.
Summary of Results Page
When reviewing an OAT, the new Summary of Results page organizes patient findings into six key clinical categories: Microbial Overgrowth, Mitochondrial Health, Neurotransmitter Metabolites, Toxic Exposure, Methylation/Detoxification, and Nutritional Needs. Each category is color-coded to show imbalance levels—optimal, marginal, or significant—so you can instantly see where to focus. Category icons are carried throughout the report, creating a consistent visual thread that supports quick prioritization of areas requiring further clinical review.
The Six Key Clinical Categories on Summary of Results Page

Microbial Overgrowth
Markers of yeast, mold, bacteria, and Clostridia species. These metabolites can indicate gut dysbiosis, contributing to inflammation, digestive issues, and systemic effects. Identifying these patterns supports targeted antimicrobial, probiotic, and gut repair interventions.

Mitochondrial Health
Intermediates of glucose, fatty acid, and amino acid metabolism involved in energy production. Abnormalities may reflect impaired cellular respiration or nutrient deficiencies impacting ATP synthesis.

Neurotransmitter Metabolites
Dopamine, serotonin, and norepinephrine/epinephrine pathway metabolites. These insights support evaluation of mood, attention, stress response, and nutrient influences on neurotransmitter pathways.

Toxic Exposure
Organic acids associated with environmental toxicants, mitochondrial stress, and glutathione depletion. Elevations may point to heavy metals, toxicant exposure, or mold-related toxins.
Methylation/Detoxification
Metabolites reflecting methyl cycling, glutathione status, and detox capacity. Imbalances may signal increased demand for methyl donors or impaired phase II detoxification.

Nutrient Needs
Direct and indirect biomarkers reflecting functional demand for B-vitamins, antioxidants, and micronutrients. These insights support optimizing nutritional status for metabolic balance.
Detailed Test Results
Following the Summary of Results page, the detailed test results section remains consistent with the previous version of the OAT report. This section includes the classic OAT categories and subsections, follows the same order of the 76 organic acids, and uses the same established reference ranges.
Each section is indicated by a purple header across the top of the page, while the gray sidebar groups related organic acids into subsections for easier clinical navigation.
Learn more about our newly designed Test Results page.
In the graphic below, we have the Intestinal Microbial Overgrowth section highlighted in purple, with the gray subsections listed as: Yeast and Fungal, Bacterial, and Clostridia Bacterial.
As we continue through the report, the format is the same—highlighting the different sections in the purple headers above, progressing through the Oxalates and continuing all the way to the Indicator of Fluid Intake at the end. The gray bar subsections appear wherever appropriate, supporting clear and consistent interpretation.
Revised Metabolic Pathways with Results Integration
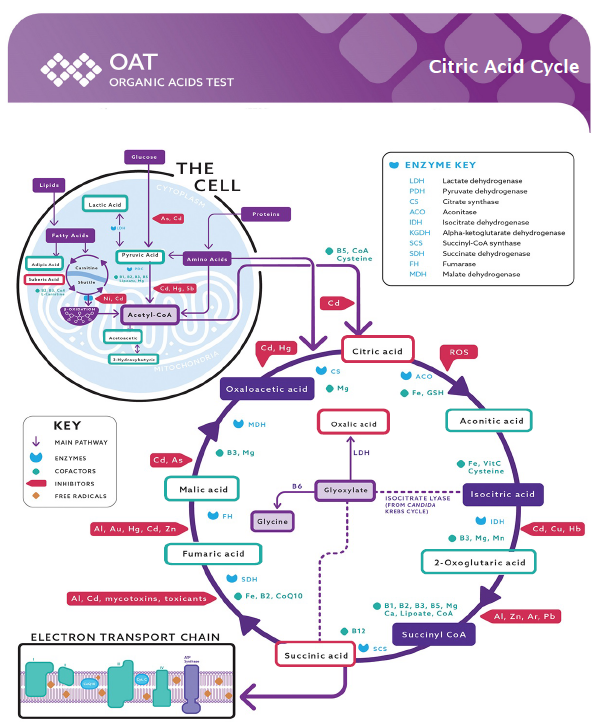
Citric Acid Cycle (Page 3)
We’ve added patient-specific results directly into the Citric Acid Cycle pathway to help clinicians
visualize potential enzyme bottlenecks, cofactor needs, and regulatory imbalances.
This refined graphic highlights key enzymes, cofactors, and inhibitors that directly influence ATP
energy production.
Metabolites measured on the OAT appear within the pathway — those outlined in red indicate abnormal findings.
Neurotransmitter Pathway (Page 5)
This graphic appears immediately after the neurotransmitter metabolites section and reflects how
phenylalanine, tyrosine, and tryptophan metabolism contribute to neurotransmitter synthesis.
Integrated OAT results show where specific biochemical imbalances may impact dopamine, norepinephrine,
epinephrine, and serotonin pathways.
Highlighted enzymes, cofactors, and regulators help clinicians better explain neurological connections.

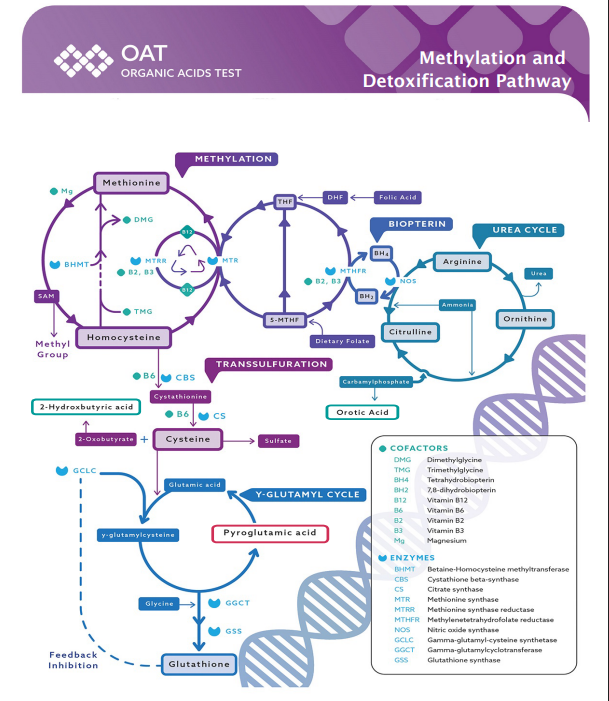
Methylation & Detoxification Pathways (Page 7)
This expanded graphic integrates methylation, transsulfuration, γ-glutamyl, biopterin, and urea cycle
pathways—giving clinicians a full view of detoxification and methylation dynamics.
Patient-specific metabolites from the OAT are mapped into each pathway, showing where imbalances may
impact glutathione recycling, sulfur metabolism, nitrogen handling, and neurotransmitter cofactor pathways.
Abnormal results are outlined in red for easy identification during consultations.
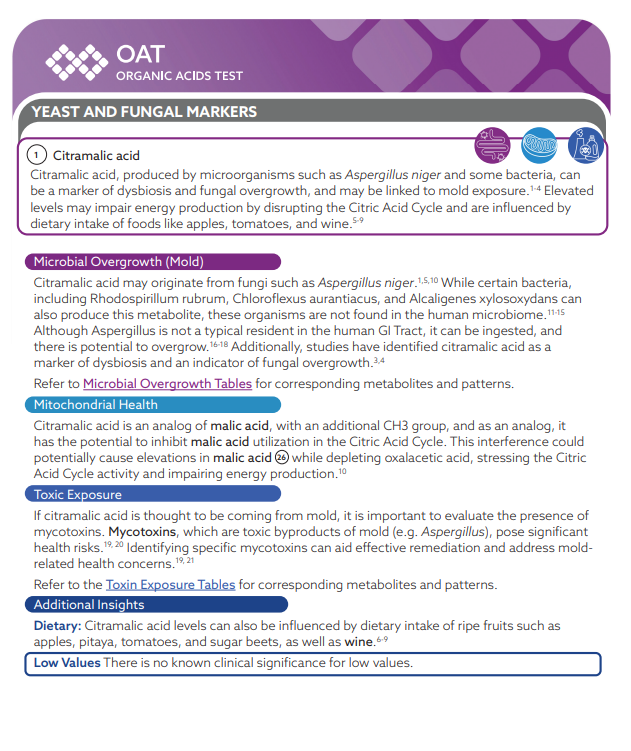
Updated Interpretations
Starting on page 10, and perhaps most importantly, we’ve expanded and refined our Interpretations. Each organic acid now includes evidence-based context, connecting abnormal findings to potential functional disruptions or underlying causes. These updated notes draw from current biochemical and scientific literature and link directly to the relevant clinical category, making the report more actionable than ever. Finally, the Interpretations use the categorized icons from the Summary of Results page to associate the organic acid to the specific clinical category being assessed.
Understanding the Updated Interpretation Layout
The new interpretation design helps clinicians quickly see how each abnormal finding maps to the
relevant clinical categories. The icon groupings in the upper right corner of every interpretation
provide an instant visual cue of which systems may be impacted.
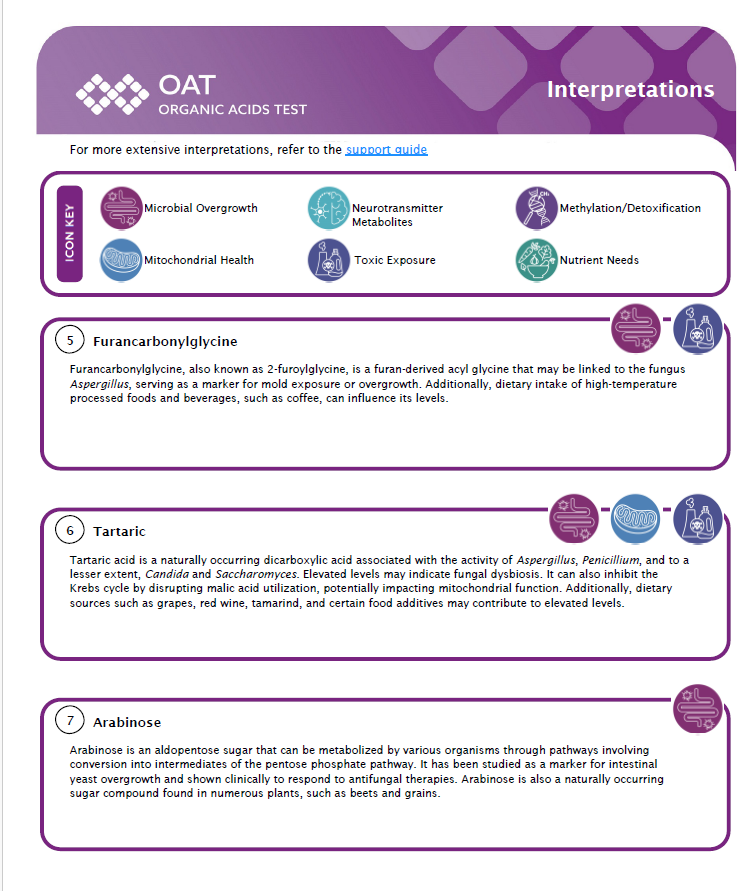
See How to Decode What’s New in the Interpretations
For example, here we see Tartaric acid (marker #6) generated an interpretation based on the report findings, and on the top right-hand corner of the Interpretation, we see the icons that correlate with Microbial Overgrowth, Mitochondrial Health, and Toxic Exposure. This clues you in that Tartaric acid may impact any or all pictured clinical categories.
New Support Guide
Lastly, the new MosaicDX Support Guide provides practitioners with expanded, fully cited reference material—including peer-reviewed sources, deeper interpretive insights, and category-specific therapeutic considerations. Whether you’re new to OAT interpretation or experienced in functional biochemistry, the Support Guide offers a robust companion to the report itself.
The Support Guide is available through a link at the top of the first Interpretations page and on our website.
The Support Guide offers more information about the OAT report and begins with an easy to navigate Table of Contents.
The Support Guide then proceeds into the Introduction to organic acid testing and more information about the Summary Page, the Key Clinical Categories, along with using marker #6, Tartaric Acid, as an example for the Explanation of Interpretations Format.
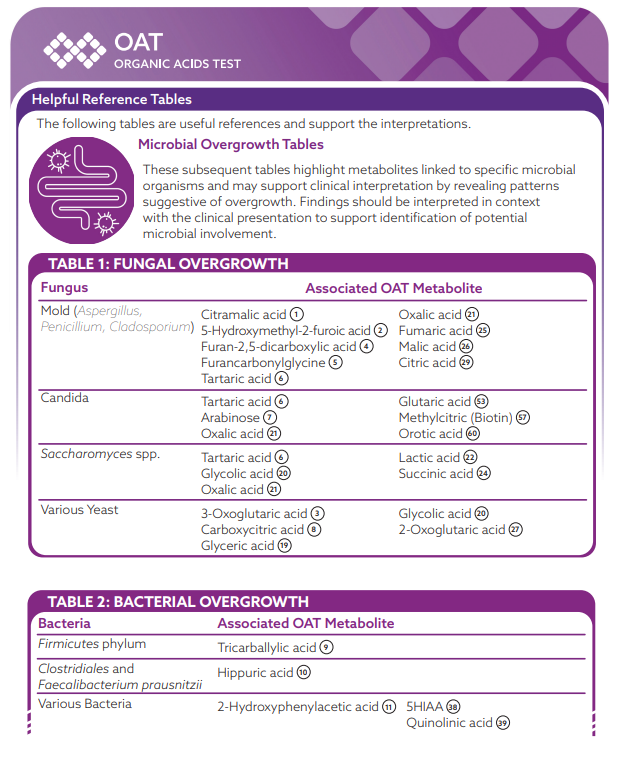
The Support Guide then continues to the helpful Reference Tables section, which highlights key metabolites that support clinical interpretations and reveal patterns of imbalance.
Table 1 of the Helpful Reference Tables links associated metabolites with specific fungal and bacterial overgrowth. These tables then continue to toxic exposure associations and nutrient references. Following the Helpful Reference Tables begins the Interpretation section—where the organic acids are presented in the same order as they appear on the test.
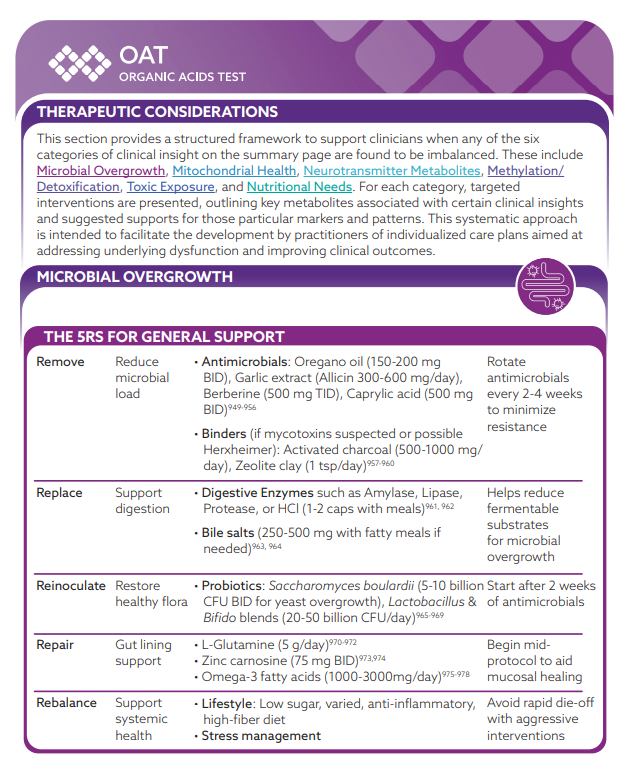
Support Guide: Therapeutic Considerations
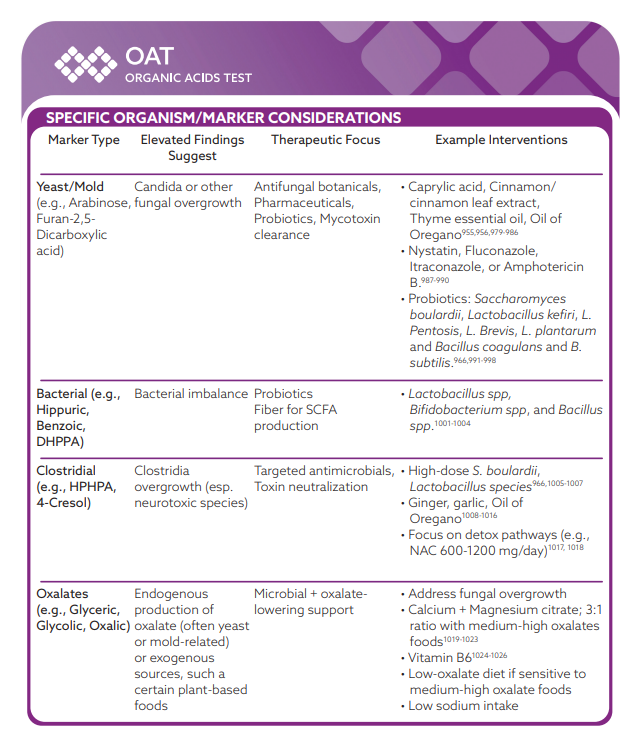
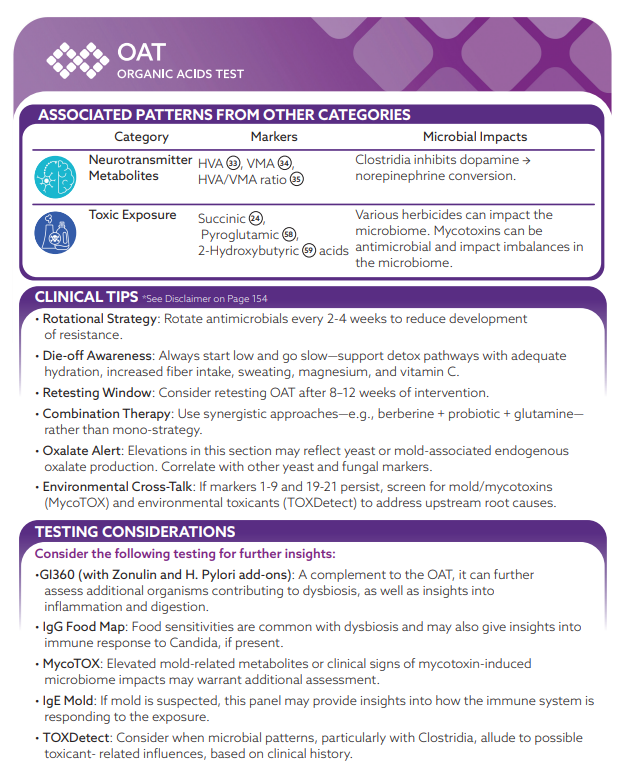
Finally, the Support Guide provides a structured framework to guide treatment when any of the six clinical categories are imbalanced in the Therapeutic Considerations section.
Check out a glimpse of how to navigate our helpful Therapeutic Considerations:
This section details targeted interventions, outlines key metabolites and patterns associated with clinical tips and additional testing considerations, and is intended to help develop an individualized care plan to address underlying dysfunctions.
The Next Generation of Functional Assessments
With this new iteration of the Organic Acids Test, we’re reaffirming our commitment to precision, clarity, and clinical relevance. Every enhancement, from layout to language, was made to support clearer interpretation, strengthen patient education, and support personalized therapeutic planning.
The updated OAT report isn’t just more readable; it’s more actionable. It empowers practitioners to see the bigger picture of metabolism and empowers patients to understand their unique biochemistry in a way that feels both clear and motivating. Click here to review and download a pdf of the enhanced OAT Report. Click here to review and download a pdf of the new OAT Support Guide.
Thank you for reviewing the OAT report. We are excited to share these updates and revisions with you. If you have more questions, please reach out to Sales, Customer Service, or schedule a Clinical Education Consult with one of our clinical team members.